Effective with the July 29, 2026 Care Compare refresh, the Centers for Medicare & Medicaid Services (CMS) has updated its Nursing Home Five-Star Quality Rating System Long-Stay QM, Short-Stay QM, and Overall QM star rating thresholds based on industrywide improvement in Quality Measure scores from January 2025 through April 2026. The updated thresholds are shown in Table 5 of the July 2026 Five-Star User’s Guide.
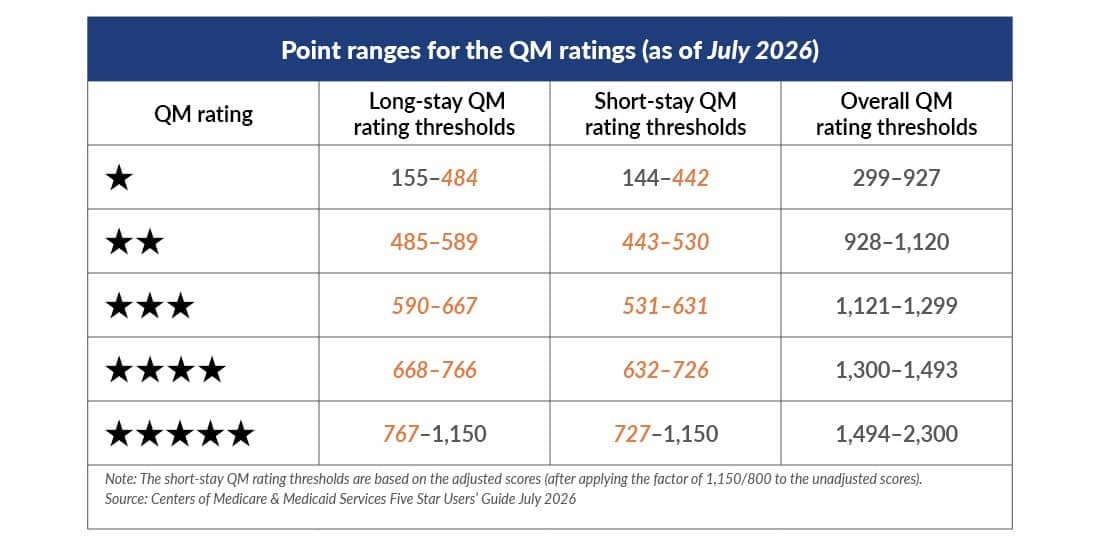
This means that some facilities may see a loss in QM star ratings even if their actual quality performance didn’t decline. This could also impact a facility’s overall composite score for reductions from 5-star QM to 4-star, or 2-star QM to 1 star.
Note: The point ranges used to score individual Quality Measures have not changed. Only the thresholds used to determine the QM star ratings have been updated. Individual QM point ranges remain as shown in Appendix Table A3 of the user’s guide.
What we’re seeing nationwide
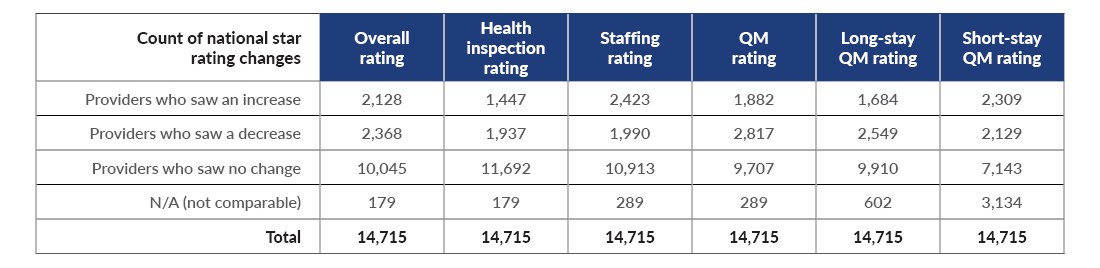
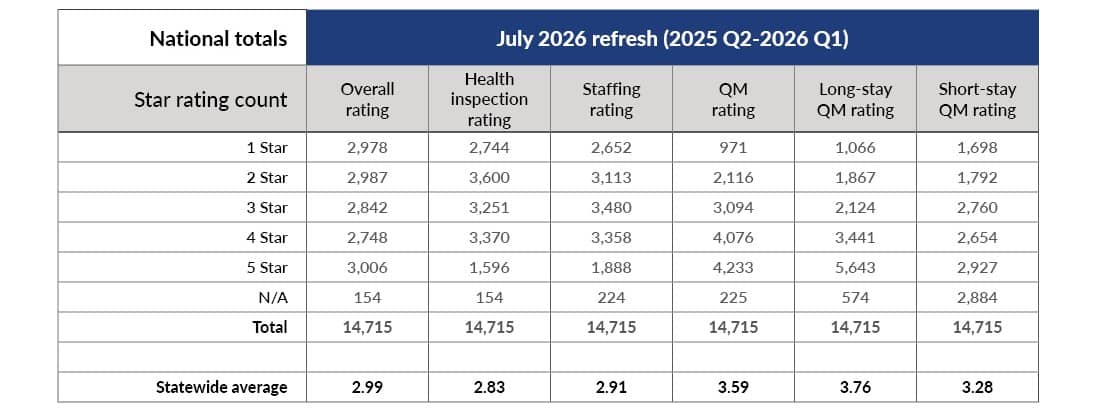
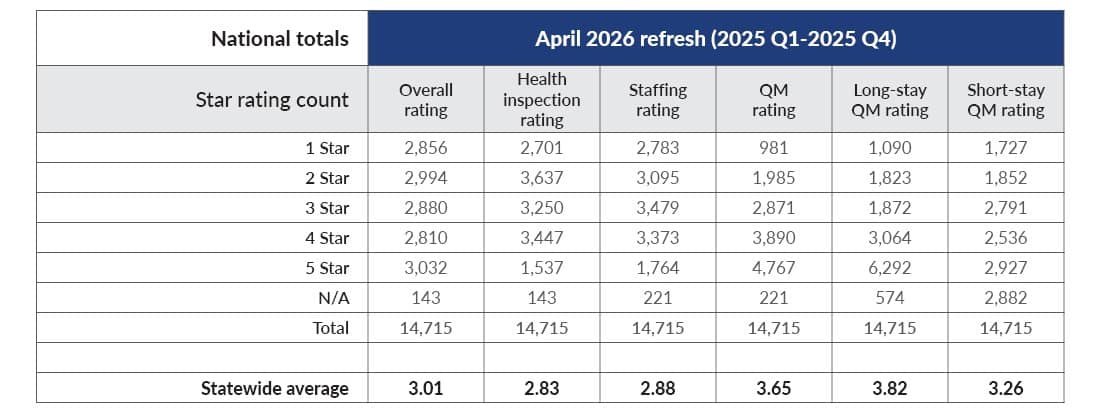
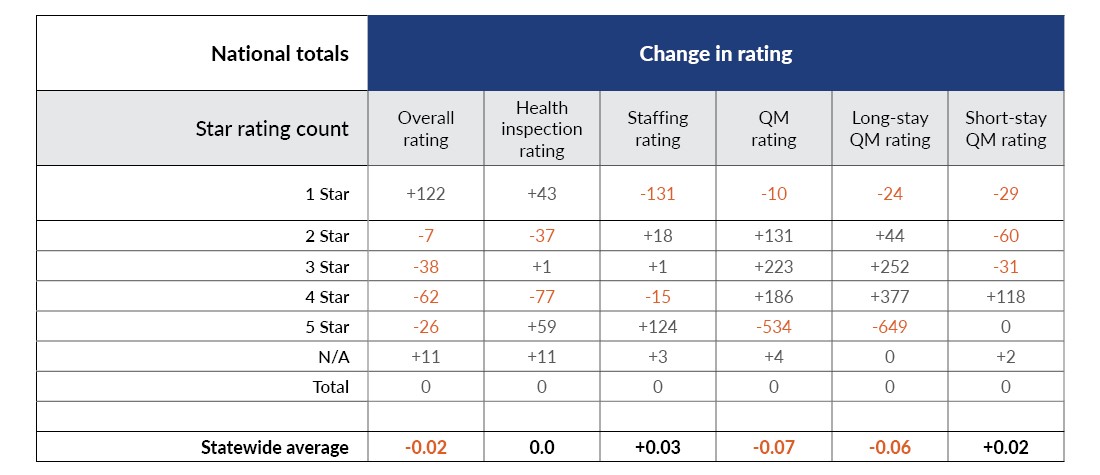
Plante Moran analyzed CMS Provider Information Dataset containing information on each Medicare-certified nursing facility in the nation, comparing the July 2026 Five-Star refresh against the April 2026 refresh. The impact is measurable: Star ratings are in motion for nearly one-third of the industry.
Overall ratings
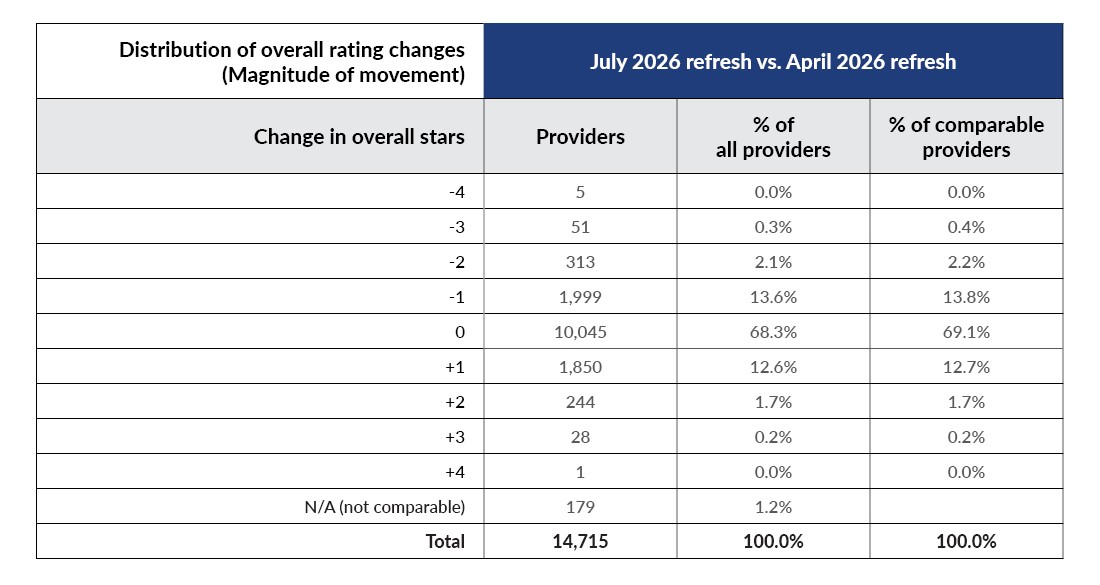
- Of the 14,715 nursing facilities nationwide, 4,491 saw their Overall Rating change — 2,123 improved and 2,368 declined.
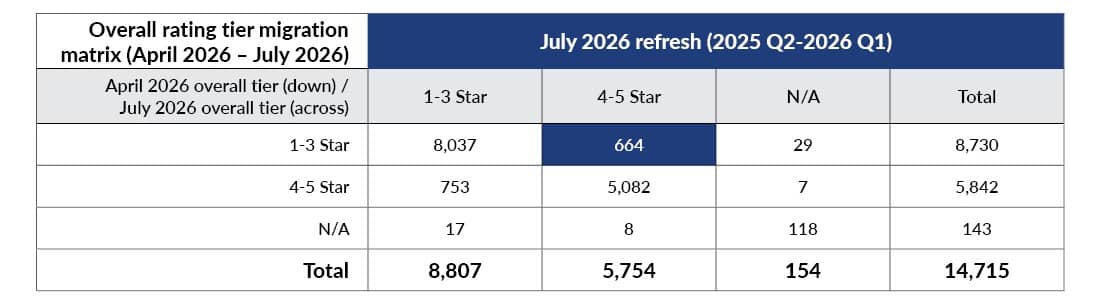
- A total of 664 facilities climbed from the 1–3-star tier into the 4–5-star tier, while 753 moved in the opposite direction.
- Single-star moves accounted for most of these swings (1,850 up, 1,999 down). Larger shifts were less common but notable: 273 facilities gained two or more stars; and 369 lost two or more — including 51 that fell three stars and five that dropped four.
- The share of 4- and 5-star facilities slipped from 40.1% to 39.5%, while the share of 1- and 2-star facilities rose from 40.1% to 41.0%.
Quality Measure ratings
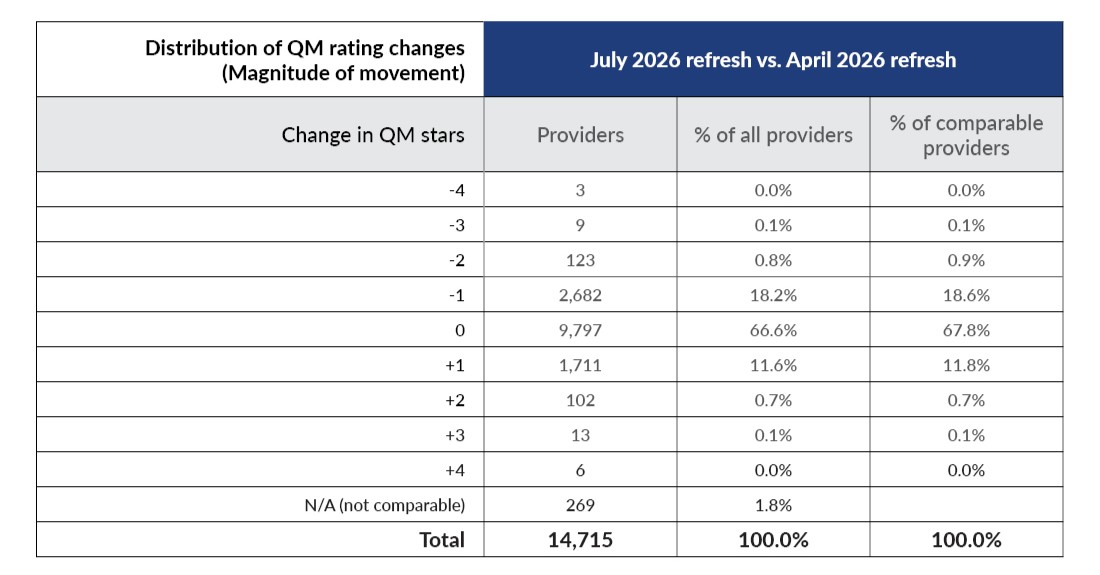
- Nationwide, 4,649 facilities saw their Quality Measure (QM) rating change: 2,817 (61%) declined and 1,832 (39%) improved.
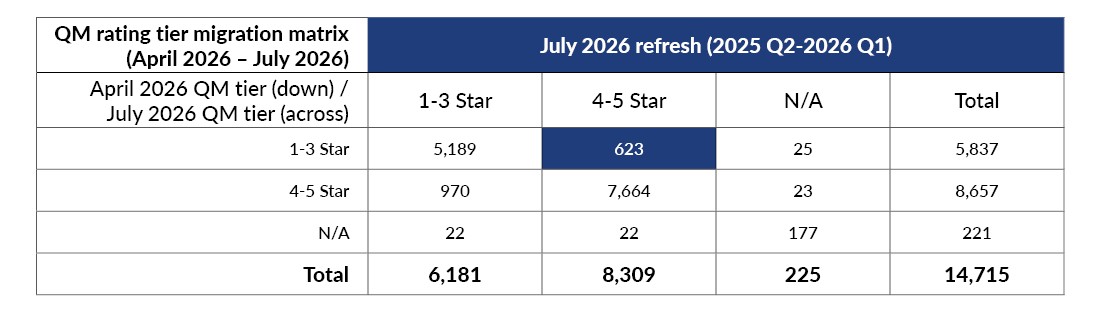
- Compression was most visible at the top of the scale. While 623 facilities moved up into the 4–5-star QM tier, 970 fell out of it — a net loss of 347.
- Single-star moves again drove most of the swings (1,711 up, 2,682 down). Beyond that, 121 facilities gained two or more stars and 135 lost two or more — including nine that fell three stars and three that dropped four.
- The share of 4- and 5-star QM facilities fell from 59.7% to 57.3%, while the share of 1- and 2-star QM facilities rose from 20.5% to 21.3%.
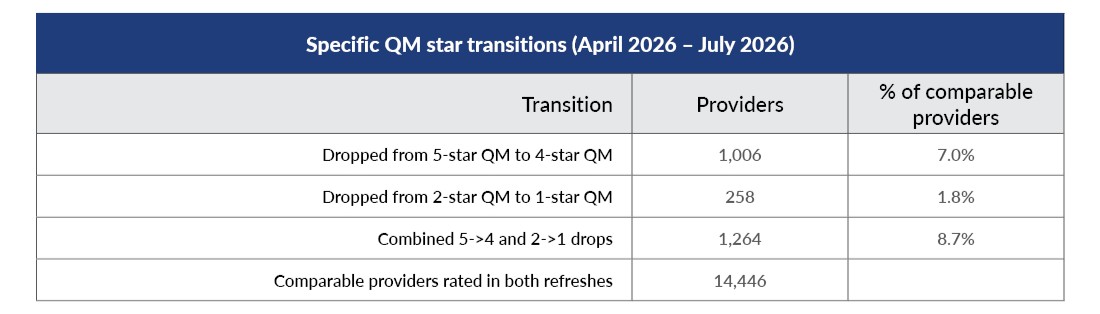
- Of the 2,682 single-star QM declines, 1,006 facilities (7.0%) dropped from a 5-star QM rating to 4-star, and 258 facilities (1.8%) dropped from 2-star to 1-star. Because QM is a component of the composite calculation, these reductions can affect a facility’s Overall Five-Star rating.
Note: Comparability denominators differ by measure. Overall percentages are based on 14,536 providers rated in both refreshes (179 noncomparable); QM percentages are based on 14,446 (269 noncomparable). This analysis measures the extent of rating movement, not its causes.
Overall ratings
Quality Measure ratings